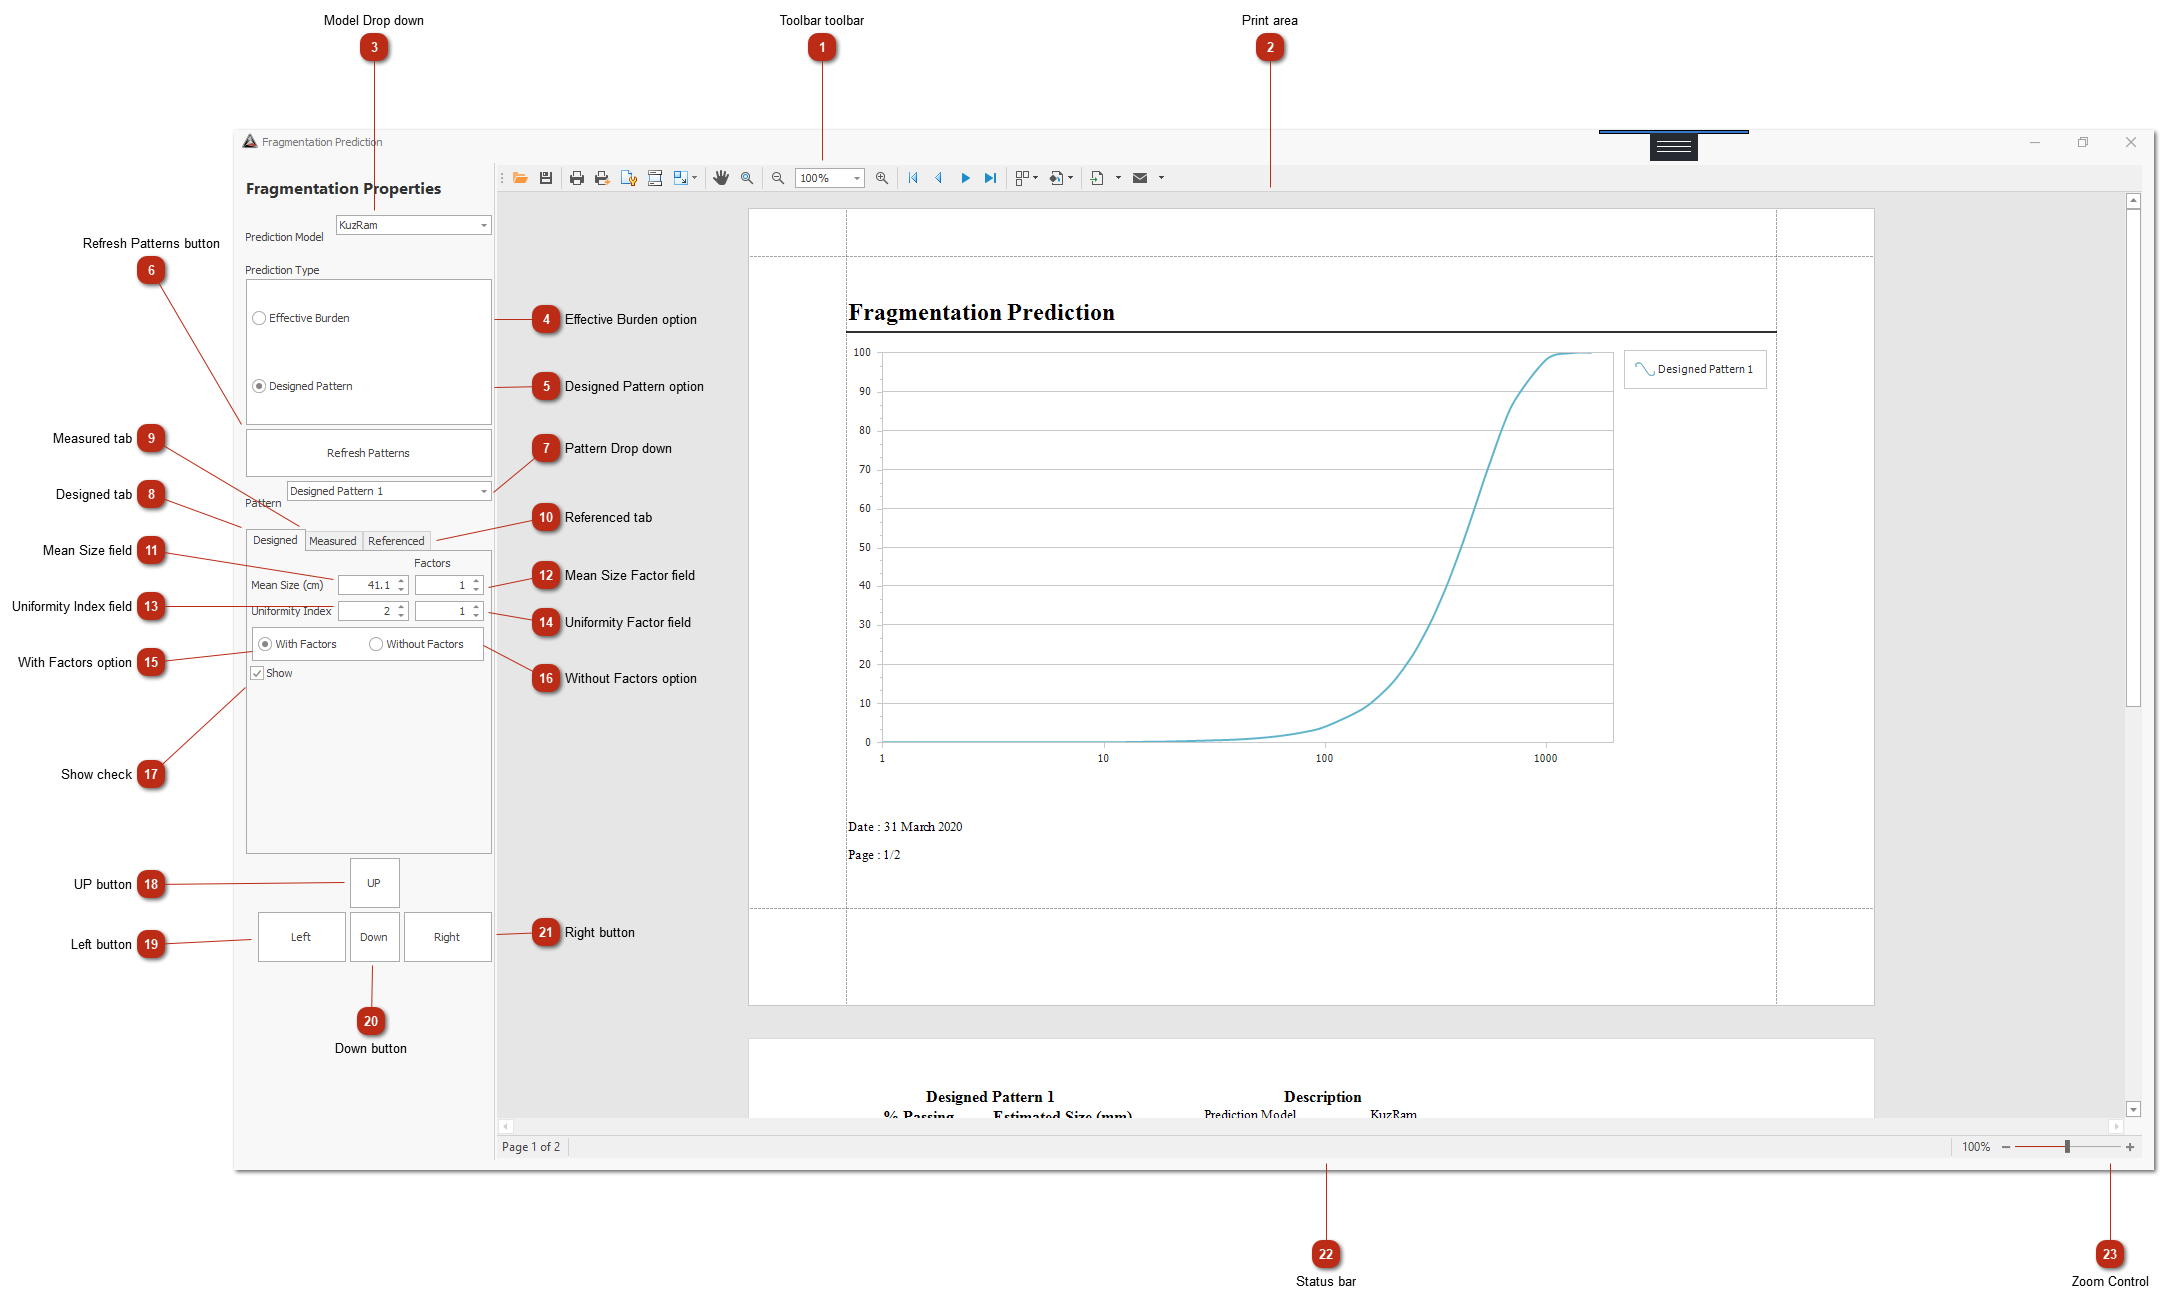
Fragmentation Prediction window
 Toolbar toolbar
|
|
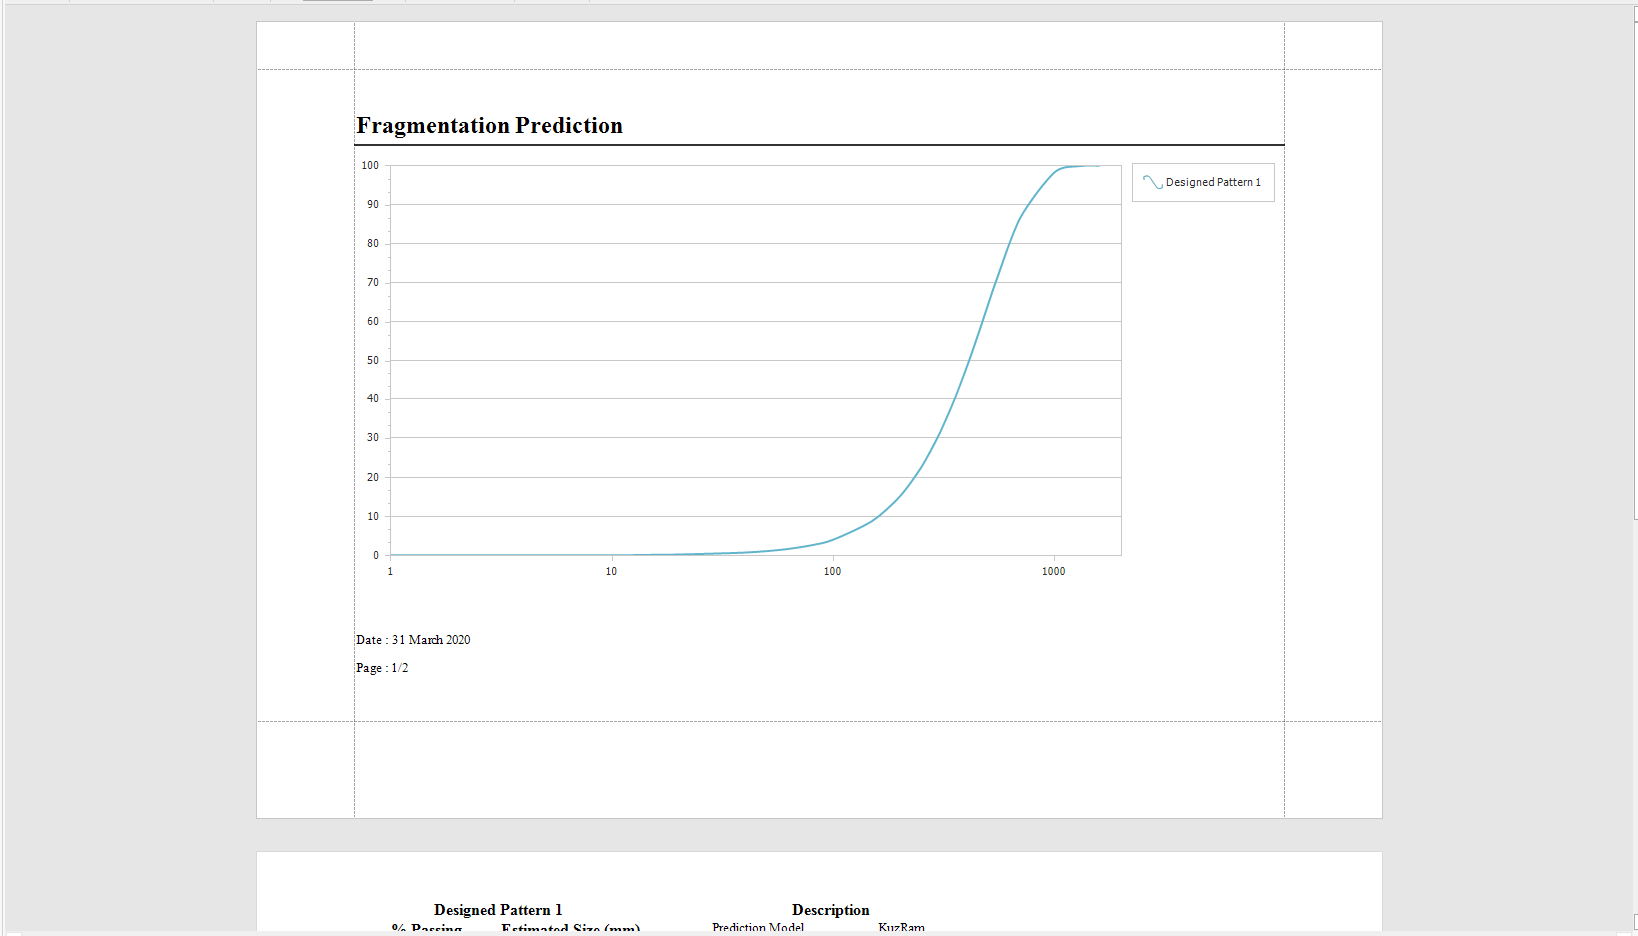
 Print area
|
|
 Model Drop downChoose the model used by the fragmentation prediction
|
|
 Effective Burden optionSelecting this will produce 3 curves in the graph based on the minimum, average and maximum effective burden.
|
|
 Designed Pattern optionSelecting this will produce 1 curve based on the pattern design applied burden and spacing.
|
|
 Refresh Patterns buttonRefreshes the fragmentation prediction.
|
|
 Pattern Drop downSelect the pattern to display the data for it below.
If there is more than one pattern on a design it will be listed here, only if the designed pattern option is selected.
if the effective burden is selected the following patterns will be listed
|
|
 Designed tabDisplays the calculated mean size and uniformity index.
|
|
 Measured tabEnter the actual measured mean size and uniformity index here.
Check the show checkbox, to overlap with your designed fragmentation.
|
|
 Referenced tabReferenced can be seen as the target / required fragmentation.
Check the show checkbox, to overlap with your designed fragmentation.
|
|
 Mean Size fieldMean fragment size of the design.
|
|
 Mean Size Factor fieldCorrection factor for mean size. Use this to calibrate the model to predict more acurately.
|
|
 Uniformity Index fieldMean uniformity index of the design.
|
|
 Uniformity Factor fieldCorrection factor for uniformity index. Use this to calibrate the model to predict more acurately.
|
|
 With Factors optionRenders the graph using your correction factors.
|
|
 Without Factors optionRenders the graph without using your correction factors.
|
|
 Show checkDisplays /hides selected pattern design.
|
|
 UP buttonMoves the entire fragmentation distribution curve upwards.
This is done by changing the mean size and uniformity index values in the backend and will be displayed in the user interface.
|
|
 Left buttonMoves the entire fragmentation distribution curve leftwards.
This is done by changing the mean size and uniformity index values in the backend and will be displayed in the user interface.
|
|
 Down buttonMoves the entire fragmentation distribution curve downwards.
This is done by changing the mean size and uniformity index values in the backend and will be displayed in the user interface.
|
|
 Right buttonMoves the entire fragmentation distribution curve rightwards.
This is done by changing the mean size and uniformity index values in the backend and will be displayed in the user interface.
|
|
 Status bar
|
|
 Zoom Control
|
|